Unlocking the Power of Data with Tableau: A Beginner’s Guide
In today’s data-driven world, the ability to analyze and visualize data is an invaluable skill. Enter Tableau, a robust data visualization tool that has taken the corporate world by storm. Whether you’re a business executive looking to make data-driven decisions or a beginner wanting to play with data, Tableau is the tool for you. This blog post will walk you through the basics of Tableau and its unmatched capabilities.
What is Tableau?
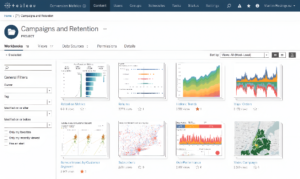
Tableau is a pioneering data visualization software that allows users to connect, visualize, and share data in a way that’s meaningful and insightful. Think of it as a canvas where raw data is transformed into a masterpiece of charts, graphs, and maps.
Why Tableau Stands Out
User-friendly Interface: Even if you’re not a data scientist or a tech geek, Tableau’s intuitive drag-and-drop interface ensures a smooth user experience.
Integration Capabilities: From Excel sheets to big data technologies like Hadoop and cloud services such as AWS and Google Cloud, Tableau integrates seamlessly with a variety of data sources.
Real-time Data Analysis: Make decisions in real-time with Tableau’s live data analytics feature. No more waiting for weekly reports!
Collaboration: Tableau isn’t just for individuals. Teams can collaborate, share insights, and publish dashboards for broader organizational visibility.
Advanced Analytics: Dive deeper into data with trend analyses, regressions, and predictive analytics, all within Tableau’s framework.
Getting Started with Tableau
If you’re convinced about Tableau’s capabilities, here’s how you can start:
Download and Install: Begin with the Tableau Desktop or the free version, Tableau Public, to familiarize yourself.
Connect to a Data Source: Import your data, be it from an Excel workbook or a cloud-based database.
Play Around: Use the drag-and-drop feature to create your first visualization. It’s as simple as selecting a data point and choosing a chart type.
Customize: Change colors, labels, and formats. With Tableau, customization options are limitless.
Share: Once satisfied with your visualization, share it with your peers, or publish it online.
Tableau’s Growing Community
Tableau is not just a software; it’s a community. There are countless forums, tutorials, and courses available online. Tableau Public, a platform where enthusiasts publish their visualizations, is a testament to this growing community.
Conclusion
In the age of Big Data, tools like Tableau are revolutionizing the way we see and understand data. With its easy-to-use interface, vast integration capabilities, and real-time data analysis, Tableau is indeed a game-changer.
Whether you’re a business looking to derive insights from data or an individual passionate about data visualization, Tableau is the perfect starting point. Dive into the world of data visualization and let your data tell its story!


